Blog
About the latest product updates from LogicRF.
Visual Simulation of The Radar Detection Range under Complex Atmospheric Environment
1.INTRODUCTION
Nowadays, for a better understanding and applying of radar, the research field of radar electromagnetic information visualization has been very keen. Traditional research methods are mainly based on numerical parameters characteristics and mapping of the two-dimensional power diagram to analyze and display. Applying radar equation, Ref [1] does numerical analysis for multi-radar's four approaches and describes the inspection method of multiradar detection range in detail. Based on numerical analysis, Ref [2] has researched radar detection capability and warning time. U.S. Navy laboratory SIGMAPLOT procedures [3] plotted the radar power in the form of twodimensional curve. However, these methods are obviously insufficient, it is also difficult to meet the demand for radar detection information visualization. Gradually, people began to pay attention to the three-dimensional representations of the radar information. As early as in 1999, Cheng Bolin [4] proposed the program of using MATLAB to draw the radar 3D scope, it realizes a simpler three- dimensional effect. Based on computer graphics and applying radar range formula to calculate the coordinates of the point on the lobe of the radar antenna, Weimin Ling [5] also realizes three dimensional display of the radar detection range. However, these programs are only simple three-dimensional visualization of radar detection range, the result is simpler, less precise, realistic. Applying U.S. Navy Advanced Propagation Model (APM) [6], Chao Yang [7] realizes the cylinder drawn of radar information dissemination, which has preferable visual effects. However, each time when changing the viewing angle, it needs to recalculate all data. So this method has higher hardware requirements, slower run speed and less efficient.
Considering the impact of the natural environment on the performance of the radar propagation and applying radar wave propagation attenuation theory, this paper proposes a computational model of radar attenuation of electromagnetic wave propagation in complex atmospheric environment. This model realizes the three-dimensional visualization of radar detection range under the complex atmospheric environment by using the rendering algorithm based on spatial sampling.
2.RADAR DETECTION RANGE MODELING
Generally speaking, in the dissemination process, radar waves energy will be attenuated (propagation attenuation). With the energy attenuation, radar waves’ signal strength is reduced. When the attenuation reached a certain level, the radar received signal is too weak, insufficient to find the target. Radar receiver sensitivity Smin is the minimum radar signal power which radar receiver is able to detect. At this time the propagation attenuation values is critical attenuation Lf0. All of the target position points whose attenuation value is not greater than the critical attenuation constitute the detection range of the radar. In this paper, through the radar parabolic equation, the main idea is mathematical modeling the radar electromagnetic wave propagation attenuation, determining the critical attenuation of all boundary position and finally realizing the radar detection range visualization.
2.1 ATMOSPHERIC ENVIRONMENT PROPAGATION ATTENUATION MODEL
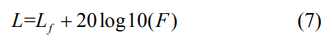
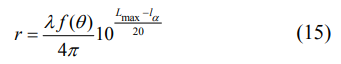
The electromagnetic wave propagation attenuation calculation formula in free space is proposed in [8]. Taking no account of atmospheric effects such as electromagnetic interference factors, Lf is only related to the frequency range and antenna pattern function:
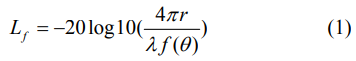
Where r denotes propagation distance , λ denotes wavelength, f(θ) denotes radar antenna directivity of the normalized,θ denotes azimuth. When calculating the actual radar electromagnetic wave propagation attenuation, it is necessary to consider the influence of atmospheric and other environmental factors. Atmospheric attenuation is caused mainly due to oxygen and water vapor. A report by CCIR [9], simplified model is as follows:
Oxygen absorption attenuation for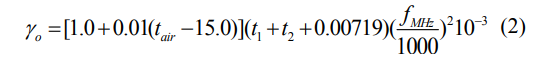
Where tair denotes the bottom surface temperature (℃), fMHZ denotes electromagnetic wave frequency, t1,t2 is expressed as follows:
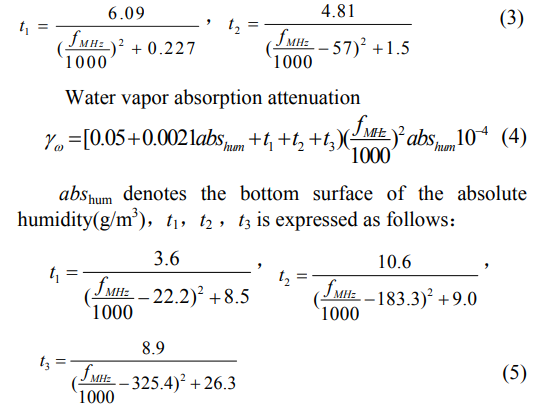
The atmospheric absorption attenuation: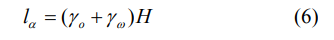
H is the height of the relative in sea level (km).The actual transmission attenuation is caused by all sorts of factors influence.
Propagation factor is considered by many other factors
on the influence of electromagnetic wave propagation, such
as atmospheric environment, electromagnetic interference.
In order to research the atmospheric environment and the
performance of the influence of transmission attenuation
(don't consider other factors such as electromagnetic interference), this paper presents a simplified propagation
attenuation model based on atmospheric environmental. Its
computation formula is as follows: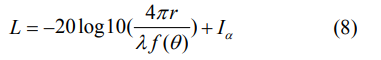
2.2 DETECTION RANGE BOUNDARY CALCULATION
The radar equation of environmental factors [10]: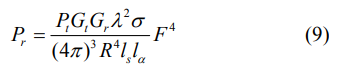
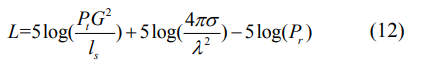
Pt, Pr denote radar launch and receive power , λ denotes electromagnetic wave length , σ denotes target reflection area,F denotes antenna direction spread factor, R denotes radar wave propagation round-trip distance;ls denotes system damping value;lα denotes Atmospheric absorption attenuation factor. Single base radar shares the same emission and receiving antenna,antenna gain, Gt=Gr =G,radar equation can be represented by:
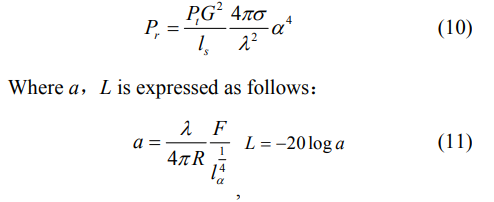
Combined with radar equation, the formula is as follows
Radar receiver sensitivity is related to radar performance, the specific calculation formula is:
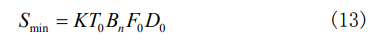
K denotes boltzmann constant ; T0 denotes the standard room temperature 290 K;Bn denotes the radar receiver noise bandwidth, F0 denotes receiver noise coefficient; D0 denotes radar detection factor.
When the receiver input signal power is not less than
Smin, the receiver can normally detect the target. When the
input signal power is less than Smin, the receiver can't detect
the input signal (It can’t identify target). From (12), when
Pr=Smin, it is easy to get the maximum attenuation value Lmax
corresponding to the minimum detectable signal:
Equation.(14) determines the maximum attenuation threshold value when radar detects signal. The three dimensional space radar wave propagation attenuation value can be gotten from (8). Through the comparison with attenuation threshold value, it is easy to determine the biggest radar detection range boundary finally.
3.VISUAL STRUCTURE AND ALGORITHM
Radar detection range visualization mainly includes the following several parts: radar detection range data modeling, modeling data analytical mapping and drawing, rendering.
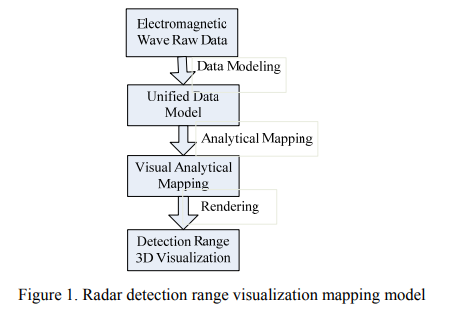
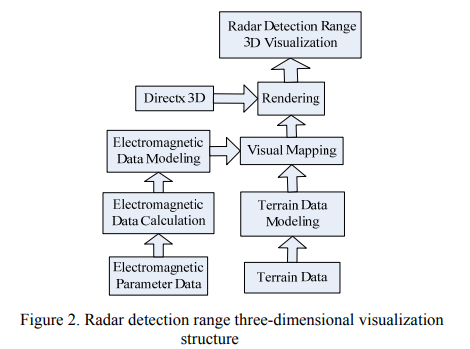
Be based on the theory of the section provides, in accordance with the derivation of mathematical formula and radar parameters, radar electromagnetic data modeling completes the radar detection range of data calculation. According to the requirements of the visualization, unified model unifies radar detection data. Visualization analytical mapping is the process that data is converted to detection range boundary data waiting for drawing and rendering. Detection range 3D visualization is drawing, rendering the data after analytical mapping and completing detection range three-dimensional visualization finally. Radar detection range of three-dimensional visualization system structure is as follows:
3.1 THREE-DIMENSIONAL VISUALIZ- ATION ALGORITHM
Assuming that the radar antenna elevation θ=π/4. Algorithm thought is: in radar as the center, mean sampling the pitching angle θ and azimuth φ, then making sure distance that each sampling direction propagation attenuation to critical attenuation. After coordinating transformation, it is easy to determining the direction of each sampling on the top position. When space sampling is large enough, the attenuation value that adjacent three sampling vertex to not sampling vertex distance is approximately equal (as the largest propagation attenuation). Therefore, it can approximate with smooth triangle strips to performance, with all three of the adjacent vertices being replaced by smooth triangular patch. It is easy to get the three-dimensional model of the radar detection range finally.
Equation (8) gives the distance relationship of radar electromagnetic propagation attenuation function. Any distance corresponding electromagnetic propagation attenuation can be gotten by (8) and maximum transmission attenuation Lmax of radar detection range can be gotten by (14). In the attenuation range L≤ Lmax, the radar can detect to the target, and all the attenuation position points form radar detection range.
From (8) and (14), it is easy to get
r devotes electromagnetic wave propagation distance. Through the conversion of the spherical coordinates and cartesian coordinates, it is easy to determine the coordinate values of the vertices in the three-dimensional space. The conversion relationship of spherical coordinates and rectangular coordinate system is
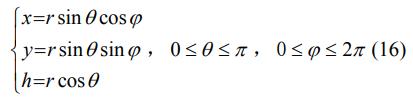
Where θ devotes the pitching angle, φ devotes the angle for antenna pattern.
This paper uses different zoning color in different points draw rendering: with the maximum attenuation value Lmax for boundary,0 → Lmax is divided into different attenuation value interval. In the rendering, different interval corresponding to different color, the color shallows in turn. Different colors represent not only the approximate scope of attenuation value, but also can image that the strength changes of spread signal.
4.APPLICATION EXAMPLE
Based on Microsoft Visual Studio 2010 programming platform, part, using C# and combining with DirectX 9.0, this paper realizes radar detection range 3D rendering.
4.1 RADAR PARAMETER SETTINGS
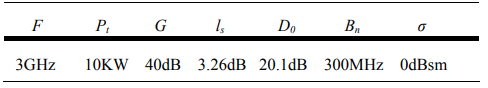
Radar main working parameters are as follows
TABLE Ⅰ RADAR WORKING PARAMETER
Radar antenna normalized pattern function f(θ)
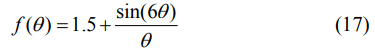
Where θ devotes antenna pattern of the azimuth. When considering the actual atmospheric environmental: tair=25℃;abshum=0.3g/m3 .
4.2 RESULTS
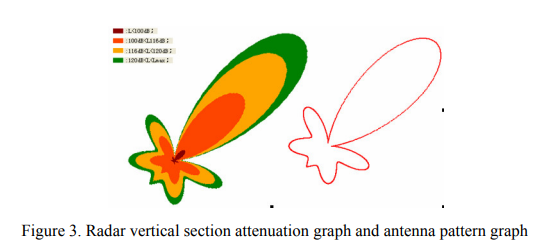
The right is the radar antenna directional diagram, radar has strong directional radiation characteristics and has more than one side lobe. When θ=π/4, radiation ability is the strongest; the left is vertical plane graph of radiation attenuation change in an ideal space. With the increasing of the distance, according to the scarlet red orange and green, color in turn changes. As distance increasing, the propagation attenuation increases gradually. In the θ=π/4 direction, color change is the slowest, i.e., the slowest rate of decay. And the side lobe attenuation is obvious much faster than main lobe. Through the calculation, the radar can detect the maximum critical attenuation is Lmax=121.468.
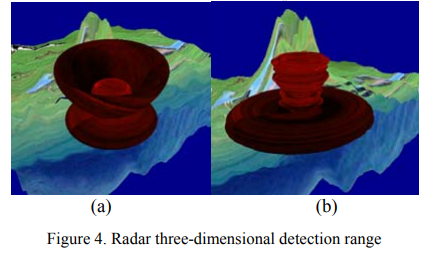
Fig.4 (a) shows the three-dimensional radar detection range in ideal space. In free space, because of no atmospheric environment factors, radar detection range map is a rule three-dimensional graphics. It is consistent with antenna pattern. Analysis shows that when θ=π/4, detection range is the maximum (The main lobe’s farthest detection direction). Fig.4 (b) shows the three-dimensional radar detection range in complex atmospheric environment. Radar detection range changes greatly, this kind of change increases along with the increasing of the height. During the process of transmission of electromagnetic wave, due to the atmospheric environmental impact, propagation attenuation increases sharply. Therefore, radar detection range reduced. From (6), it is known that this kind of influence is proportional to the height. In corresponding direction, the radar detection range is smaller. The influence near the ground is very small, it can be ignored. So near the ground, radar range almost has no change.
5.CONCLUSION
Considering the impact of the natural environment on the performance of the radar propagation and applying radar wave propagation attenuation theory, this paper proposes a computational model of radar attenuation of electromagnetic wave propagation in complex atmospheric environment. Meanwhile, considering the actual theory and drawing requirements, this paper proposes a rendering algorithm based on approximate sampling. Ultimately, adopting the efficient software tools and simulating actual terrain scene, this paper not only realizes radar detection range in the ideal space, but also realizes the radar detection range threedimensional visualization in complex atmospheric environment. Through contrast, this paper visually displays the radar detection range on the influence of complex atmospheric environment and the application results are vivid and precise. It provides a good reference value for radar research.
Xiaoyou Yu1 ,Yubing Bai1,2,3 ,Jun Xu1 ,Tiejun Chen1 ,Ling Yin1,3
College of Information Science and Engineering of Hunan University, Changsha, Hunan Province, China
Unit 91821 of PLA, Chaozhou, Guangdong Province, China
Satellite Navigation R&D Center, School of Electronic Science and Engineering of National University of Defense Technology, Changsha, Hunan Province, China
References
[1] P.F. Sammartino, C.J. Baker and M. Rangaswamy. “Coverage in radar networks”. Proceeding of Conference Record of the Forty First Asilomar Conference on Signals, Systems and Computers, 2007, pp.197-201.
[2] J.B.Liu, X.C.Guan and J.W. Lu. “Radar detection capability analysis and simulation in complicated electromagnetic environment”.Systems Engineering –Theory &Practice,2008,28(5), pp.142-147.
[3] C.N. James, S.R. Brodzik and H. Edmon.“Radar data processing and visualization over complex terrain”.Journal of Computer-Aided Design & Computer Graphics.2000,10 (3), pp.327-338.
[4] P. L. Chen and W. Zhang.“Realizing radar detection range drawing using MATLAB language”. Journal of The air force radars university.1999, 13(4), pp.62-64.
[5] W. M. Ling and D. Q. Liu. “Realizing radar detection range of 3D display using OpenGL technology”. Journal of wuhan university of science and technology, 2002, 26(1), pp. 72-75.
[6] A. E. Barrios and W. L. Patterson.“Advanced propagation model (APM) Vet, 1. 3. 1 Computer software configuration item (CSCI) doucuments”. Technical Document 3145, 2002.
[7] C. Yang, J. B. Xu and L. D. Wu. “The drawing of radar spread information cylinder under complex environment”. Mini-Micro Systems, 2010, 31(9), pp.37-39.
[8] C. F. Zhang. “Clutter modeling and simulation technology and its application in radar signal simulator research”. Changsha, National University of Defense Technology, 2004.
[9] International Radio Consulting Committee (CCIR) XVth Plenary Assembly Dubrovnik.Propagation in non-ionized media.International Telecommunications Union, Recommendations and Reports of the CCIR, Geneva,1986.
[10] E. Barrios. “Considerations in the development of the advanced propagation model(APM)for U S navy applications” Proceedings of the International, Radar Conference,2003, pp.77-82.